 Skip to content
XRP’s upward momentum has taken a hit after the price failed to reclaim its previous high of $2.9, sparking a fresh decline that has resulted in the price dropping toward previous support levels. The rejection has raised questions about the strength of the bulls and whether they can regain control to steer the price back to higher levels.
Bearish Build-Up On The 4-Hour Timeframe
With bearish pressure mounting, the focus now shifts to key support zones and whether the bulls can hold firm against the downside movement, preventing XRP from experiencing a much deeper correction.
On the 4-hour chart, XRP exhibits negative sentiment, attempting to drop below the 100-day Simple Moving Average (SMA) as it trends downward toward the $1.9 support level. Specifically, a continued descent to this support suggests that selling pressure is intensifying, and if the support fails to hold, the asset could experience more declines.
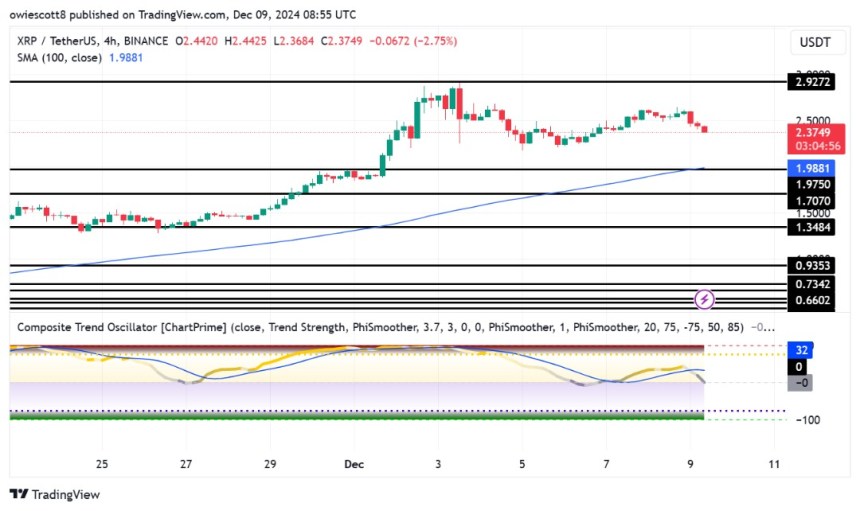
Also, an analysis of the 4-hour chart reveals that the Composite Trend Oscillator’s trend line has fallen below the SMA line, signaling a potential shift in momentum as it edges closer to the zero line. This indicates a struggle to sustain upward movements and points to moderate bearish pressure, leading to a cautious market sentiment. If the signal line continues to drop, it may trigger heightened selling activity.
Price Set Up For XRP On The 1-Day Timeframe
On the daily chart, the crypto giant displays significant downward movement, highlighted by a bearish candlestick after a failed recovery attempt to surge toward its previous high of $2.9. The inability to sustain an uptrend implies a lack of buyer confidence and a prevailing pessimistic sentiment in the market. As XRP aims at the $1.9 support level, the pressure from sellers could intensify, raising concerns about the possibility of a breakdown.
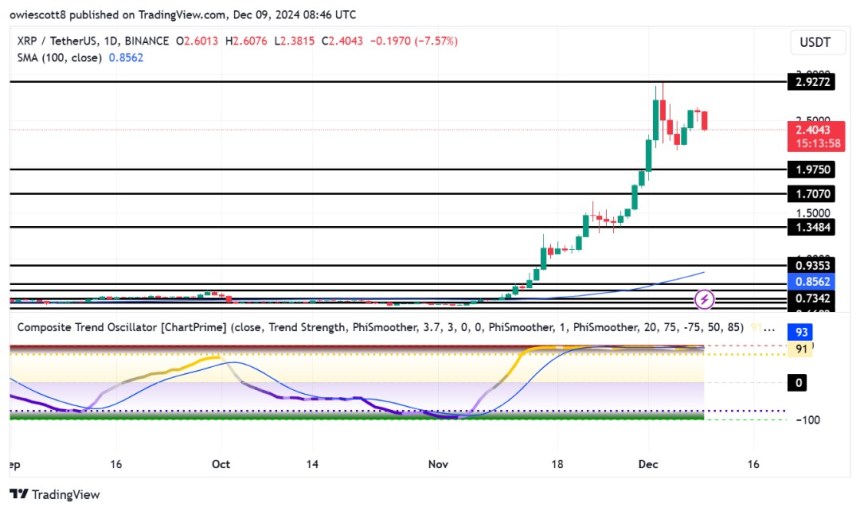
Finally, the 1-day Composite Trend Oscillator signals growing bearish momentum, with the indicator’s signal line dropping below the SMA after lingering in the overbought zone. This development suggests a possible shift in market dynamics as the overbought conditions may give way to increased selling pressure. A crossover of the signal line below the SMA is often interpreted as a bearish signal, indicating that the upside momentum could be weakening.
Related Reading: XRP Price Steadies Above Support: Preparing for the Next Move?
Conclusively, as XRP faces renewed negative pressure, key support levels become crucial in determining its next move. Meanwhile, the first level to watch is $1.9, which could act as an initial buffer against further declines. A sustained break below this level might open the door for a deeper drop toward $1.7, a region of significant historical activity. If bearish momentum persists, the $1.3 mark could serve as the last line of defense before a broader selloff ensues.
Source link
#XRP #Slides #Failing #Reclaim #Whats #Bulls
top altcoins, Ethereum alternatives, new cryptocurrencies
crypto trading bots, automated trading strategies, AI in cryptocurrency
Bitcoin mining, Ethereum mining, best crypto mining hardware
Bitcoin news, cryptocurrency latest news, blockchain updates
best crypto wallets, secure Bitcoin wallets, multi-currency wallets reviews
blockchain technology, fintech innovations, decentralized finance (DeFi)
crypto market analysis, Bitcoin price prediction, Ethereum forecast
cryptocurrency predictions, Bitcoin price forecast, crypto trends 2024, crypto trends 2025
live Bitcoin prices, crypto price updates, Ethereum price report
how to trade cryptocurrency, crypto trading strategies, beginner crypto trading
Welcome to “Cryptocurrency Trading,” your comprehensive destination for the latest news and analysis in the world of **cryptocurrencies** and **currency trading**. We provide rich content focused on **market analysis**, **trading strategies**, and **emerging technologies** that impact the **cryptocurrency market**. Join us to discover the **best investment opportunities** in **Bitcoin**, **Ethereum**, and other leading cryptocurrencies. Our goal is to equip you with the information you need to enhance your trading skills and achieve success in the world of **investment**. Follow us for continuously updated content that supports you in making informed decisions.
 Price Is Pumping While Most Altcoins Struggle")


